By Tomydas Pall, Senior Product Manager
It’s vital to have visibility into the health of your integration infrastructure — especially when you’re relying on private agents to power critical connections.
That’s why Jitterbit launched Agent Observability Metrics in Harmony. With Agent Observability, you can detect and resolve issues faster, reduce downtime through early warnings, balance workloads by optimizing Agent usage, and monitor system health with confidence.
Phase 1 of Agent Observability, released earlier this year, allowed customers to monitor private agent activity through popular third-party platforms. With Phase 2, we now offer a native experience inside Harmony — delivering rich metrics and real-time insights directly within the Management Console.
Why Agent Observability?
Private agents operate behind firewalls, support on-premise workloads, and connect sensitive systems. When they experience issues, the impact can be widespread and hard to diagnose — and traditional tools often leave customers in the dark.
Agent Observability Metrics change that, offering visual, real-time insights that help teams:
- Quickly detect failing or overloaded agents
- Monitor performance metrics like CPU and memory
- Drill into detailed usage data without hunting for logs
- Act proactively instead of reactively
Jitterbit’s Multi-Tiered Approach to Agent Observability
Jitterbit has designed a phased observability strategy:
Phase 1: Integration with Third-Party Monitoring Tools
Many Jitterbit customers already use Datadog and Elasticsearch, which are among the most popular enterprise observability platforms. That’s why we made it easy to integrate agent health data into these tools.
With this setup, customers can:
- Centralize monitoring across infrastructure
- Use familiar dashboards to track agent heartbeat, CPU, disk, and memory usage
- Detect startup and connectivity issues in real time
Phase 2: Native Metrics and Health Monitoring in Harmony
With this release, native observability is now built directly into the Harmony platform management console. The upleveled Agent Metrics page offers increased visibility without the use of external tools.
Built to optimize speed and clarity, this page provides immediate insight into the health of their private agents, without the added complexity of traditional monitoring.
These insights include:
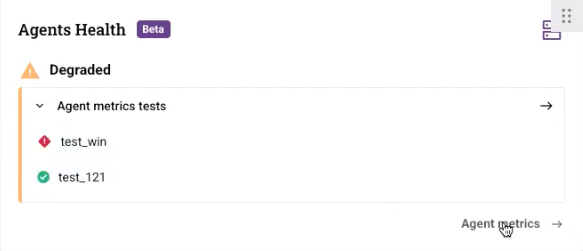
- A real-time summary of Agent and Agent Group status
- A dynamic, interactive view of Agent Groups
- Health status of individual Agents via color-coded indicators (green, yellow, red)
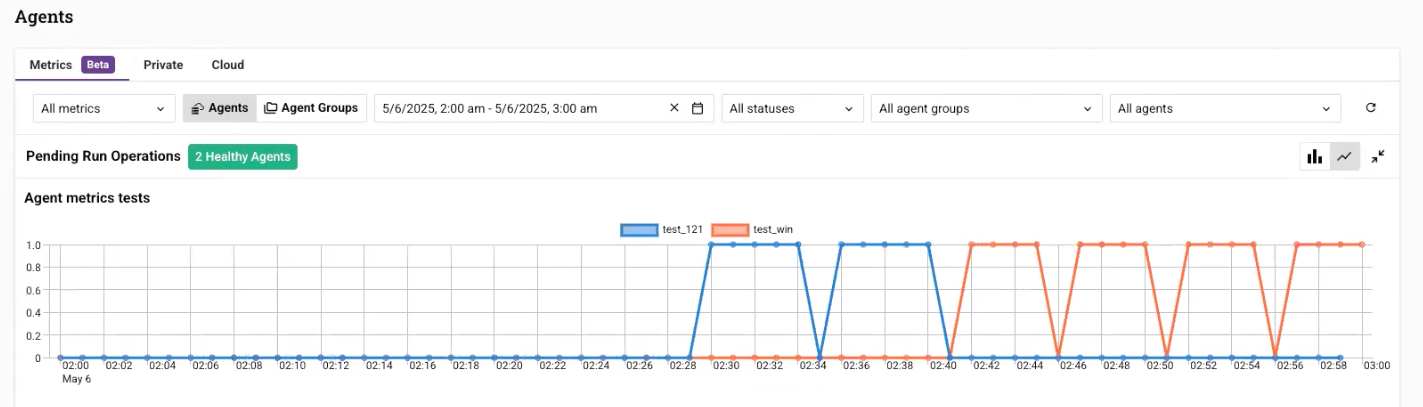
- Charts showing agent health over time — from multi-day to minute-by-minute
- Automatic synchronization of time range across all charts for a unified view of related performance data
- Easy access to exact values and patterns for fast diagnostics
Comprehensive Agent Metrics
The Agent Metrics page offers a layered view into both the capabilities and internal services of each private agent — giving users a complete picture of operational health.
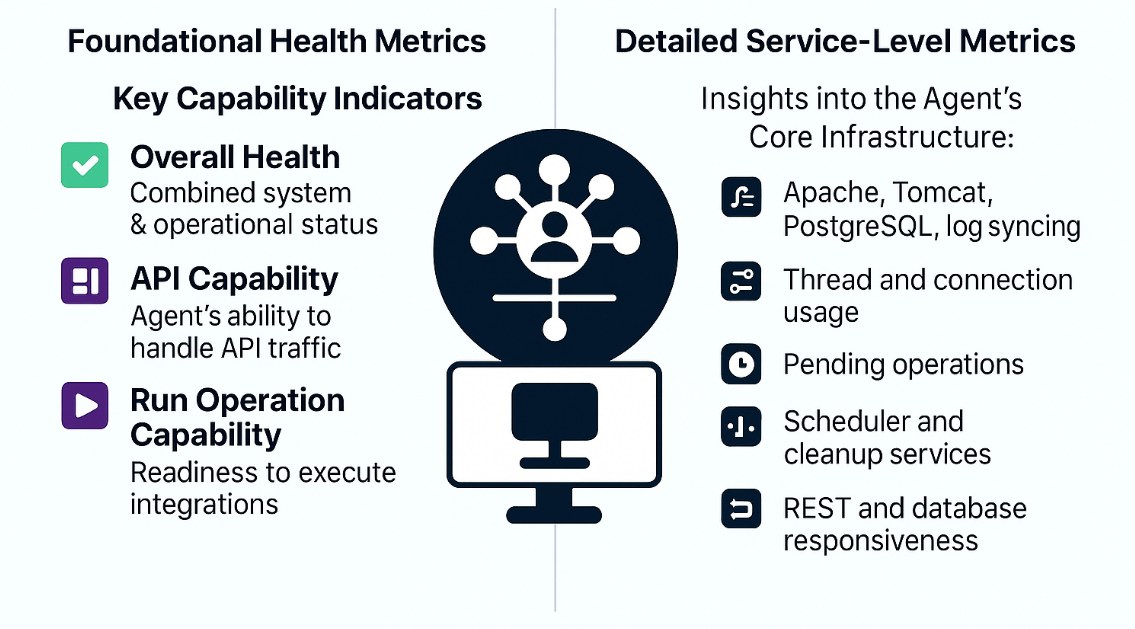
Key capability indicators include:
- Overall Health: Offers combined status across system and operational components
- API Capability: Indicates the Agent’s ability to handle API traffic
- Run Operation Capability: Reflects readiness to execute integration operations
- System Resource Capability: Tracks CPU, memory, and disk usage for resource planning
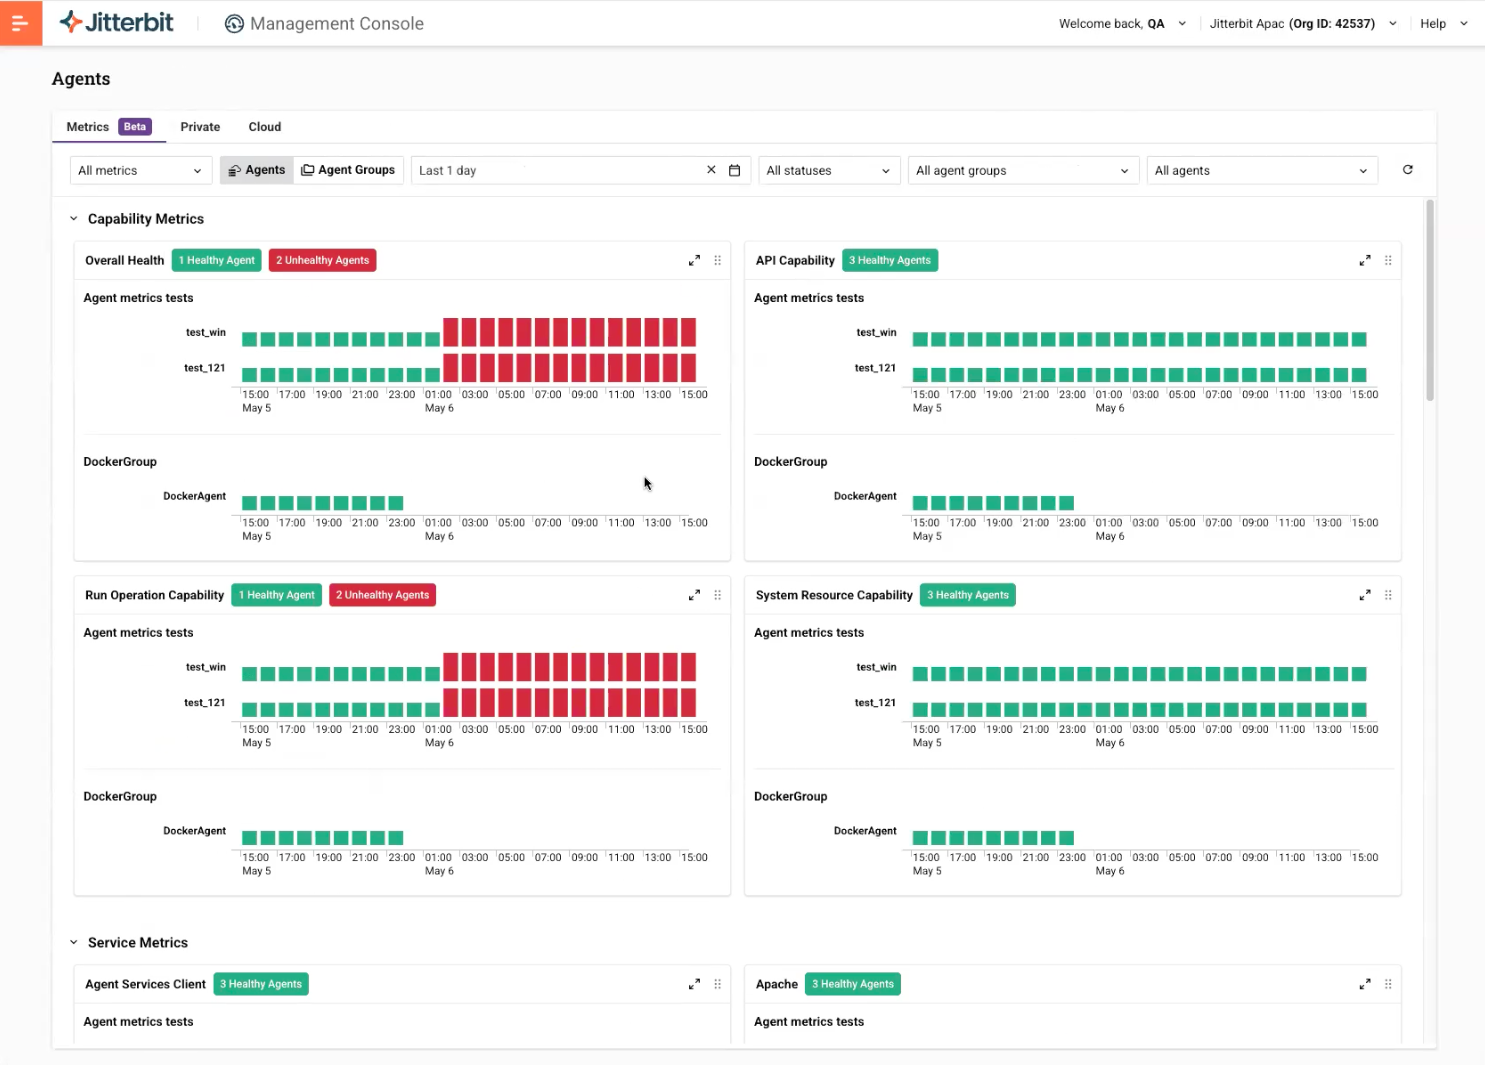
In addition, detailed service-level metrics offer insights into the Agent’s core infrastructure — including Apache, Tomcat, PostgreSQL, log syncing and more. Users can monitor:
- Thread and connection usage
- Pending operations
- Scheduler and cleanup services
- REST and database responsiveness
Together, these metrics allow teams to pinpoint the root causes of performance issues and maintain optimal agent reliability at scale.
What can you monitor? A complete picture
What’s Next?
In future releases, we’ll be introducing:
- User-defined threshold alerts to proactively flag performance issues
- AI-powered anomaly detection to identify unexpected behavior
- Historical trend visualizations for deeper performance analysis
- Enhanced integration with log and error reporting for root-cause troubleshooting
Agent Observability is just one part of our broader mission to make Jitterbit Harmony more intelligent, resilient and transparent. We look forward to your feedback as we continue to improve your integration experience. Find out how to set up third-party monitoring or leverage Harmony’s native monitoring.